
Last updated on April 17, 2026
The Metropolitan Police processed 737,198 speeding offences in 2025. A Freedom of Information request has produced the full breakdown: every case split by speed limit, speed band, detection method, and outcome. More than half of all detections were in 20mph zones. A third of all camera cases had no resolved outcome at the point the data was extracted.
London’s speed enforcement operation is vast. In 2025, the Metropolitan Police detected and processed 737,198 speeding offences across its camera network and officer-issued traffic offence reports. That is roughly one detected offence for every 13 people in London, and nearly three times the 277,069 cases we recently reported on from West Yorkshire Police.
The data was released following a Freedom of Information request submitted as part of a batch to ten forces across England, Wales, Scotland, and Northern Ireland. Of the ten, the Met and West Yorkshire have so far provided full responses. The remaining eight are at various stages of internal review or awaiting updates.
Where the West Yorkshire dataset offered a clear picture of how a large regional force processes speeding cases, the Met data tells a different story in several important respects. The sheer scale is one difference. The composition of the dataset is another. And the volume of unresolved cases raises questions that the data alone cannot answer.
What the Met disclosed
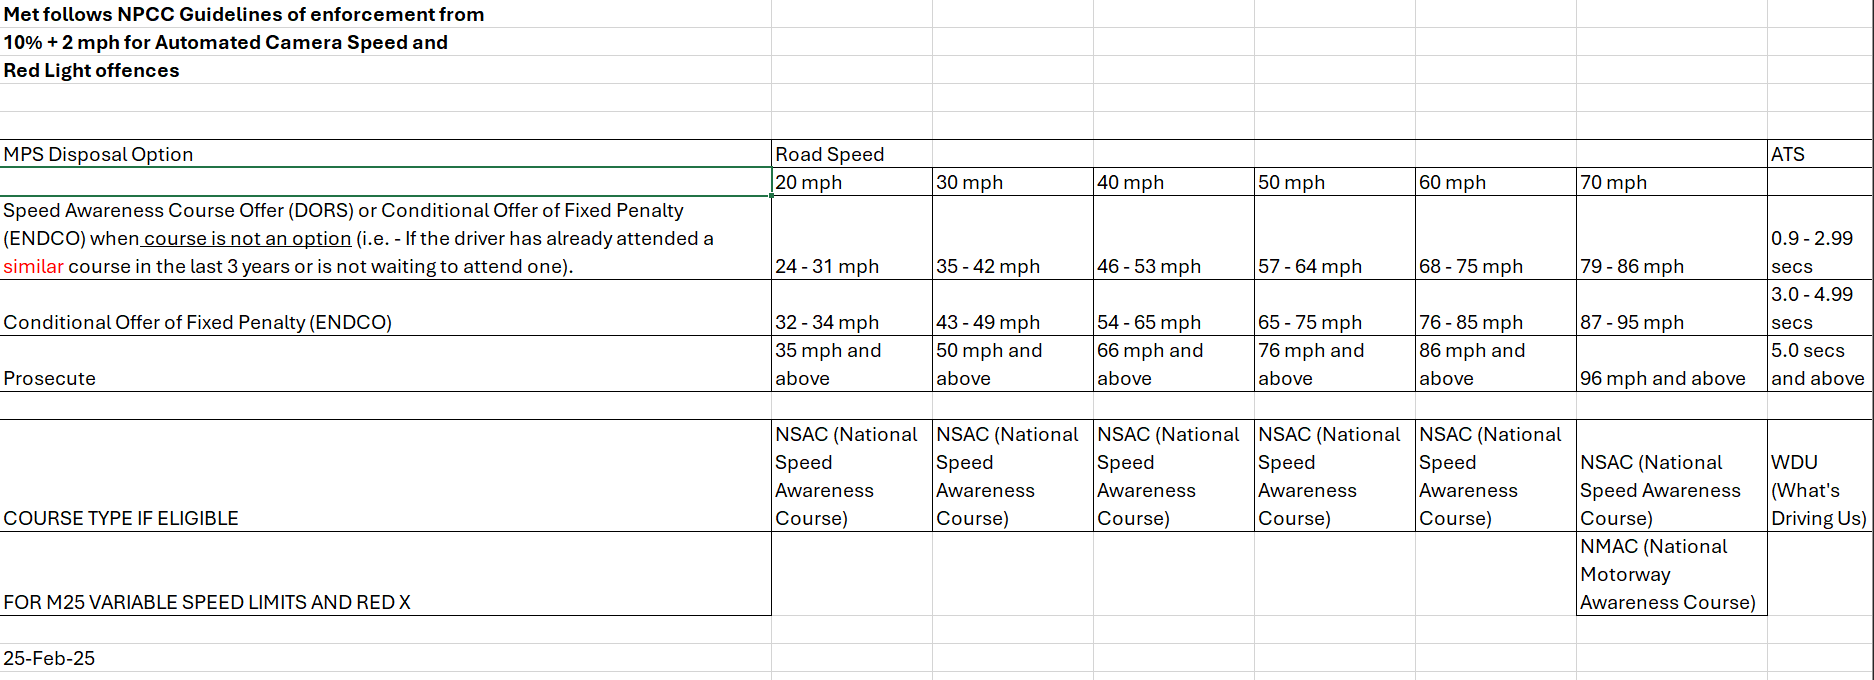
The response came with two attachments. The first is a detailed outcomes spreadsheet covering all camera-detected offences and officer-issued traffic offence reports (TORs) for calendar year 2025, broken down by offence type, speed limit, excess speed band, and disposal outcome. The second is something less commonly released: the Met’s own enforcement thresholds workbook, setting out the exact speed ranges at which courses, fixed penalties, and prosecution apply for each posted limit.
This is notable. In previous FOI requests, the Met refused to disclose its enforcement thresholds. A 2008 request was refused under section 31 (law enforcement), with the Met arguing that releasing speed bands would allow drivers to second-guess the likelihood of being caught. The same position was taken in 2011 and again in subsequent years. The thresholds have since been published on the Met’s own website in response to a separate FOI, and the workbook disclosed here confirms them in operational detail.
Met Police enforcement thresholds by posted speed limit
| Disposal | 20mph | 30mph | 40mph | 50mph | 60mph | 70mph |
|---|---|---|---|---|---|---|
| Course / FPN | 24–31 | 35–42 | 46–53 | 57–64 | 68–75 | 79–86 |
| FPN only | 32–34 | 43–49 | 54–65 | 65–75 | 76–85 | 87–95 |
| Prosecution | 35+ | 50+ | 66+ | 76+ | 86+ | 96+ |
The enforcement floor is 10% + 2mph, consistent with NPCC guidance. At 20mph that means enforcement begins at 24mph. At 30mph, 35mph. The Met confirmed it holds no local guidance beyond the NPCC framework and the thresholds workbook.
20mph zones dominate the dataset
The most striking feature of the Met data is where the offences are happening. More than half of all detected cases occurred in 20mph zones.
394,016 offences in 20mph zones. That is 53.4% of the entire dataset. In West Yorkshire, 20mph zones accounted for just 17,395 cases, or 6.3% of the total. The Met’s 20mph figure alone is larger than the entire West Yorkshire dataset.
This reflects London’s extensive rollout of 20mph limits. Transport for London and the London boroughs have systematically lowered speed limits on residential streets, high streets, and through-routes over the past several years. The camera infrastructure has followed. The result is that 20mph enforcement now generates more detected offences than every other speed limit combined.
Within 20mph zones, the concentration at the lowest speed band is extreme. Of the 362,162 automatic camera detections at 20mph, 341,155 were in the “up to 9mph over” band. That is 94.2% of all 20mph camera cases, and represents drivers recorded at speeds between 24mph and 29mph.
20mph zone outcomes by speed band (automatic cameras)
| Speed band | Course | Paid | Prosecution | NFA | Ongoing | Total |
|---|---|---|---|---|---|---|
| Up to 9mph over | 122,340 | 69,211 | 17,233 | 32,001 | 100,370 | 341,155 |
| 10–14mph over | 2,716 | 3,394 | 1,475 | 3,470 | 5,393 | 16,448 |
| 15–19mph over | — | — | 843 | 1,014 | 946 | 2,803 |
| 20–24mph over | — | — | 190 | 474 | 286 | 950 |
| 25–29mph over | — | — | 50 | 234 | 99 | 383 |
| 30mph+ over | — | — | 42 | 274 | 107 | 423 |
A driver doing 29mph in a 20mph zone is within the course eligibility band (24 to 31mph under the Met’s thresholds). The data confirms this: 122,340 drivers in the lowest 20mph band completed a course. But 17,233 in the same band were flagged for potential prosecution, and 69,211 paid a fixed penalty. The question that recurs whenever this data is published is why two drivers caught at the same speed receive different outcomes.
The NPCC framework makes course eligibility conditional. A driver can only be offered a Speed Awareness Course if they have not attended one in the previous three years and are not already waiting to attend one. Repeat offenders within that window lose eligibility regardless of the speed at which they are caught. The most likely explanation for prosecutions appearing alongside courses at the same speed is prior offending or repeat detection.
The data does not include offending history, so this cannot be confirmed directly. But the pattern is consistent with the NPCC framework operating as designed.
The 245,000 cases with no resolved outcome
The most significant number in this dataset is not a disposal outcome. It is the “Ongoing” column.
Across all camera-detected cases, 245,034 had no resolved outcome at the point the data was extracted. That is 33.5% of all camera cases. One in three detections sitting in the pipeline with no course, no fixed penalty, no prosecution, and no NFA recorded against them.
245,034 camera-detected speeding cases had no resolved outcome. That is a third of the Met’s entire camera enforcement workload for the year.
The FOI response letter states that the figures were “produced from live operational systems (Dome and PentiP) and may be subject to small changes as records are updated.” This means some of the Ongoing cases may simply be in-progress enforcement. A NIP has been issued, the Section 172 response is pending, or a course offer is awaiting acceptance. The data represents a snapshot, not a final ledger.
But the scale is still difficult to dismiss. Even allowing for pipeline lag, a third of the caseload sitting unresolved suggests either a very long processing cycle, a significant volume of cases that will never reach a disposal outcome, or both. For context, West Yorkshire’s equivalent category (“Not Completed”) accounted for 26,317 cases or 9.5% of their total. The Met’s Ongoing rate is more than three times that proportion.
The 20mph zone alone accounts for more than 100,000 Ongoing cases in the lowest speed band. That is 100,370 NIP letters sent to registered keepers for detected speeds of up to 29mph, none of which had a recorded outcome at the time the data was pulled.
30mph zones: still substantial
Although 20mph zones now dominate the Met’s enforcement data, 30mph zones still account for roughly 150,500 offences across all detection methods. The outcomes table for the two largest automatic camera categories at 30mph (local traffic orders and restricted roads) shows a similar pattern to 20mph, with courses and paid penalties concentrated in the lowest band and prosecution climbing steeply at higher speeds.
30mph zone outcomes by speed band (combined automatic cameras)
| Speed band | Course | Paid | Prosecution | NFA | Ongoing | Total |
|---|---|---|---|---|---|---|
| Up to 9mph over | 42,200 | 21,550 | 6,406 | 14,377 | 42,882 | 127,415 |
| 10–14mph over | 2,433 | 2,079 | 1,316 | 3,218 | 5,212 | 14,258 |
| 15–19mph over | 3 | 452 | 419 | 1,012 | 1,133 | 3,019 |
| 20–24mph over | — | — | 215 | 457 | 343 | 1,015 |
| 25–29mph over | — | — | 82 | 206 | 143 | 431 |
| 30mph+ over | — | — | 59 | 304 | 159 | 522 |
At the lowest band in 30mph zones, 6,406 drivers were flagged for potential prosecution alongside 42,200 who completed a course. As with 20mph zones, repeat offending and prior course attendance are the most likely explanation for this overlap.
The motorway picture
At 70mph (the national motorway and dual carriageway limit), the Met recorded 11,556 automatic camera detections. The pattern differs from urban zones in one important respect: the Ongoing column is much smaller, both in raw numbers and proportionally.
70mph zone outcomes by speed band (automatic cameras)
| Speed band | Course | Paid | Prosecution | NFA | Ongoing | Total |
|---|---|---|---|---|---|---|
| Up to 9mph over | 1,369 | 756 | 102 | 861 | 432 | 3,520 |
| 10–14mph over | 2,166 | 1,271 | 224 | 1,759 | 883 | 6,303 |
| 15–19mph over | 161 | 293 | 74 | 430 | 237 | 1,195 |
| 20–24mph over | — | 60 | 10 | 141 | 86 | 297 |
| 25–29mph over | — | 5 | 13 | 82 | 22 | 122 |
| 30mph+ over | — | — | 17 | 87 | 15 | 119 |
The NFA rate at 70mph is notably high. At the 10 to 14mph band, 1,759 cases ended in NFA against 2,166 courses completed. That is a NFA rate approaching 28%, considerably higher than in urban zones. Whether this reflects evidential difficulties with motorway camera systems, keeper identification failures for vehicles travelling longer distances, or something else entirely, the data does not say.
TOR cases: a different enforcement world
The dataset splits cases into two categories: camera-detected offences (732,115 cases) and Traffic Offence Reports issued by officers using handheld equipment (5,083 cases). The TOR cases have a completely different disposal profile.
Of 5,083 officer-issued TOR cases: 2,565 (50.5%) were sent for prosecution; 1,867 (36.7%) resulted in a paid fixed penalty; 479 (9.4%) completed a course; 93 (1.8%) were ongoing; and 79 (1.6%) received NFA.
The prosecution rate for TOR cases is nearly nine times the rate for camera cases. This likely reflects the fact that officers with handheld equipment are typically deployed at locations where speeds are expected to be higher, or during targeted enforcement operations where course eligibility is less common.
TOR data also includes offence categories not found in the camera data, such as exceeding the 70mph limit on dual carriageways (308 cases), goods vehicle speed limits (3 cases), and a single offence for exceeding a temporary 60mph motorway restriction during road works.
The outcome labels matter
The Met’s data uses different labels from those used by West Yorkshire, and the FOI response letter explains why. The operational systems (Dome and PentiP) “record outcomes, not offers.” This means the data shows what actually happened, not what was initially offered. “Retraining Course Attended and Completed” means someone finished the course. “Paid Confirmed” means someone paid the fixed penalty. “Potential Prosecution” (for cameras) and “Sent for Prosecution” (for TORs) mean the case was referred, though not necessarily that a conviction followed.
This is arguably more useful than offer-based data. It tells you what actually resolved. But it also means the figures are not directly comparable with forces that record offers rather than completions, and it means a case where a course was offered but not attended would not appear in the course column.
What this data cannot tell us
The data does not include driver history, so the relationship between repeat offending and disposal outcome cannot be tested. The NFA category is not explained. The Ongoing cases are not broken down by how long they have been in the pipeline. The data does not record whether cancellations or NFA decisions relate to evidential failures, keeper identification problems, or administrative errors.
What the data does provide is a clear picture of the scale and shape of speed enforcement in the UK’s largest policing area. It shows that 20mph enforcement now accounts for more than half of all detected offences. It shows that the graduated disposal model (courses, then fixed penalties, then prosecution) broadly operates as the NPCC framework intends. And it shows that a third of all camera cases are sitting in the system with no recorded outcome.
This FOI request was sent as part of a batch to ten forces. Of the remaining eight, four are awaiting internal review (North Yorkshire, Derbyshire, Durham, and Greater Manchester), two need status updates (West Midlands and Police Scotland), one is awaiting internal review (Police Service of Northern Ireland), and one is awaiting internal review (Merseyside). When further responses arrive, direct comparison between forces will become possible for the first time across this level of detail.
One in three camera-detected speeding cases in London had no resolved outcome. Whether that reflects a slow pipeline or a broken one is the question this data leaves open.
Sources & methodology
FOI reference: Metropolitan Police Service, 01/FOI/26/050507/J, response received March 2026.
Request submitted by: Jamie Halliday via WhatDoTheyKnow, 5 February 2026.
Data period: Calendar year 2025.
Data source: Live operational data from Dome and PentiP systems, as stated in the Met’s response letter. The original disclosed documents are available for download above and via WhatDoTheyKnow. Figures may be subject to small changes as records are updated.
Policy basis: NPCC Speed Enforcement Disposal Guidance. Met confirmed no local guidance beyond the attached thresholds workbook.
Outcome labels: The Met’s systems record outcomes, not offers. “Retraining Course Attended and Completed” indicates course completion. “Paid Confirmed” indicates FPN payment. “Potential Prosecution” (cameras) and “Sent for Prosecution” (TORs) indicate referral. “NFA” indicates no further action. “Ongoing” indicates no resolved outcome at the time of data extraction.
Totals: Camera grand total: 732,115. TOR grand total: 5,083. Combined: 737,198. Speed limit aggregations are calculated from the detailed data. Where variable speed limits apply (M25 and similar), these are included in the overall total but noted separately where relevant. Minor differences between aggregated band totals and stated category totals may reflect rounding or suppressed small counts.
Comparison note: References to the West Yorkshire dataset throughout this article are drawn from our earlier analysis of FOI 2860753/26 (West Yorkshire Police, responded 26 February 2026). The two forces use different outcome labels and recording systems; direct numerical comparison should be treated with appropriate caution.

Is this the same for average speed check zones in London